Sales Forecasting
We're late on planning! It's the last day of the Fiscal Year, so we have 1 full year of data, but we still need to set targets for the upcoming year!
We'll start by (1) creating a mock dataset for analysis, then (2) testing and selecting a forecasting model. Finally, we'll (3) use the new forecast to help set targets for the upcoming year.
1. Creating the Dataset
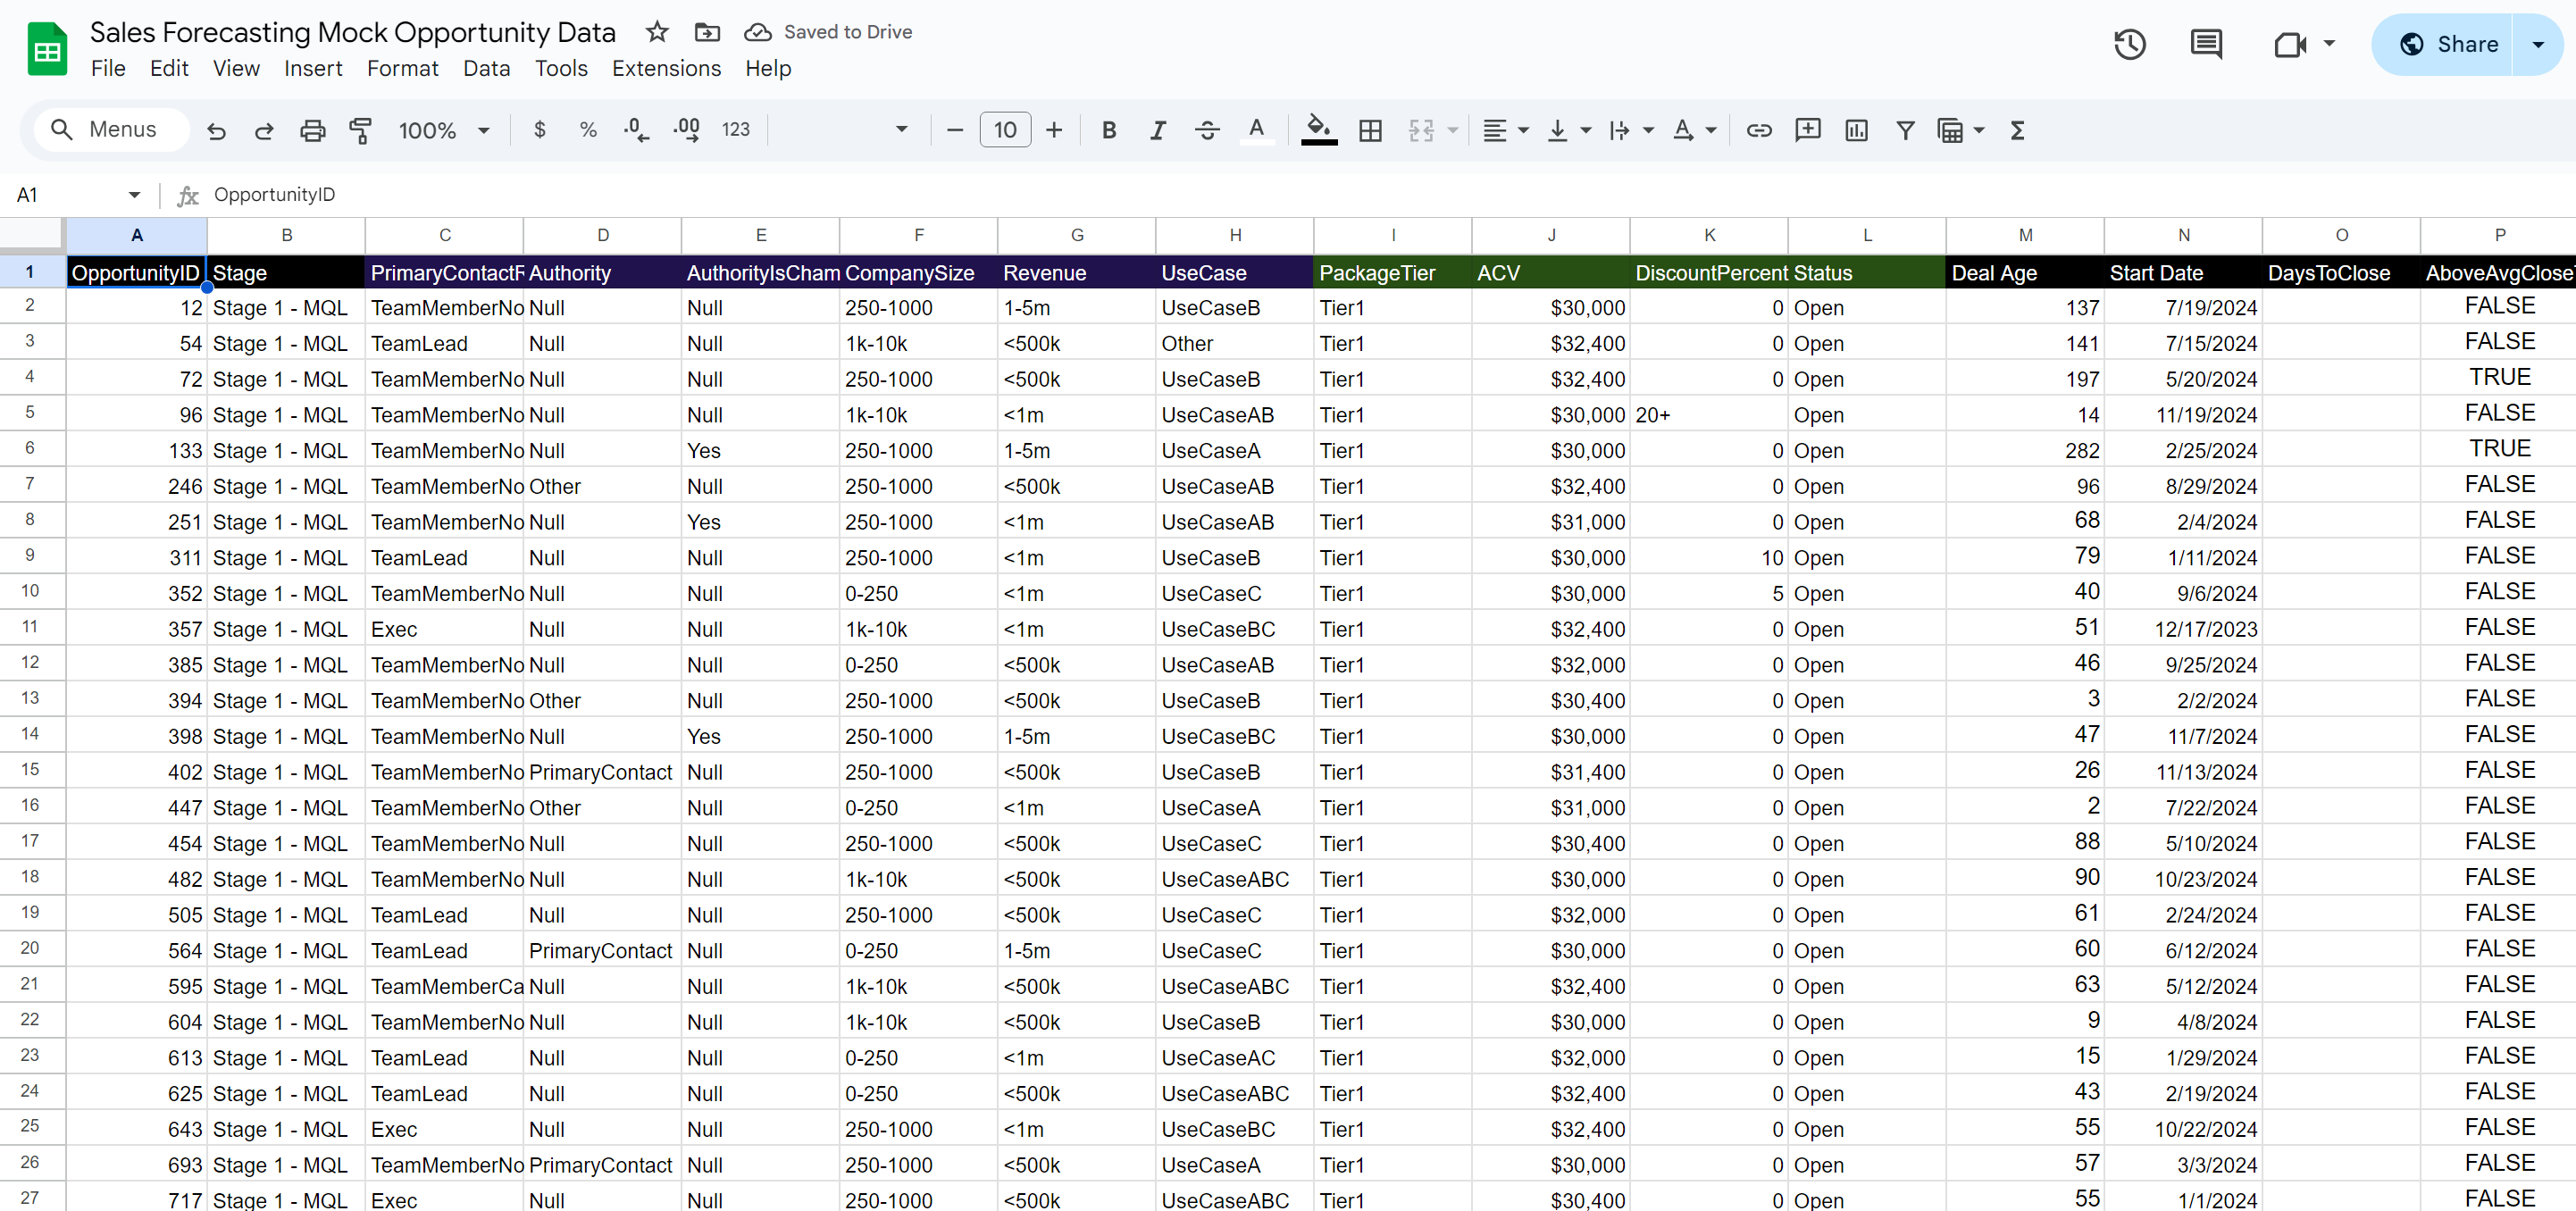
To make this somewhat realistic I created a custom dataset with common Opportunity features.
2. Model and Evaluate
First I use ChatGPT to create a scaffold for a model, with some minor adjustments.
We're using the XGBoost model. We could try KNN, which predicts outcomes based on previous similar cases, but we don't have a lot of complex features that would take advantage of KNN. Instead, XGBoost will run multiple tests with slight variations, and weight the results for a final prediction.
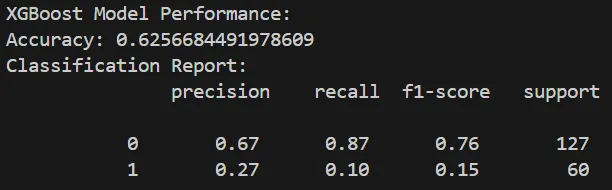
At first our results are not great... Our win rate in FY24 was 26%, and it seems that the model is just guessing that most opportunities will be Lost in FY25.
The top "0" row is "Lost" opportunities. Specifically looking at Recall, 87% of Lost opportunities were correctly predicted but only 10% of Won opportunities were correctly predicted. This is a telltale sign of over-fitting from imbalance (guessing).
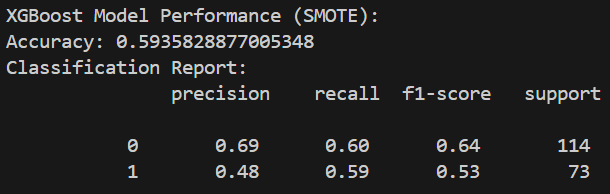
To account for this, we test several changes. We create custom features, remove some features, and tune the model.
The big adjustment was using SMOTE to create duplicative "Won" opportunities to balance the dataset. SMOTE creates new, fake examples that are similar to existing minority examples (ie: Closed Won Opps). This risks over-fitting the model based on limited examples that may not represent reality if we had more data, so it's often a good idea to have multiple models you can evaluate over time.
Along with removing some redundant features (UseCases are directly tied to ACV here), this got us to about 60% correct for both Won and Lost. Normally we would refine this further but we would also have more data, so we'll take this and move on with the Sales Forecasting Process.
With Shapley summaries, we can review the output for patterns.
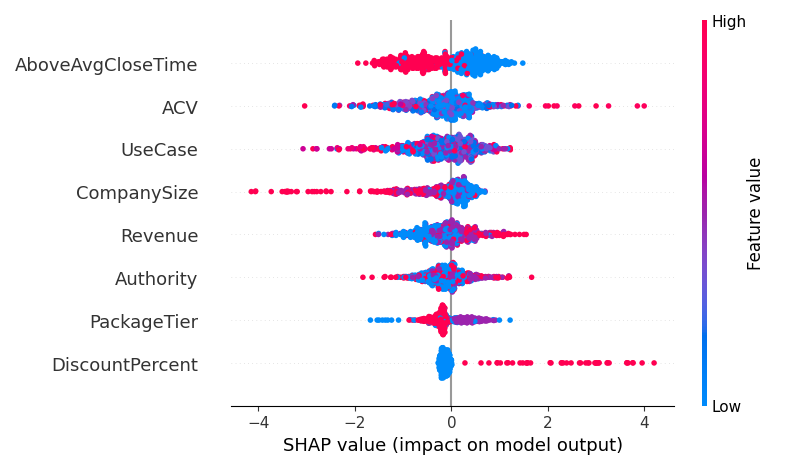
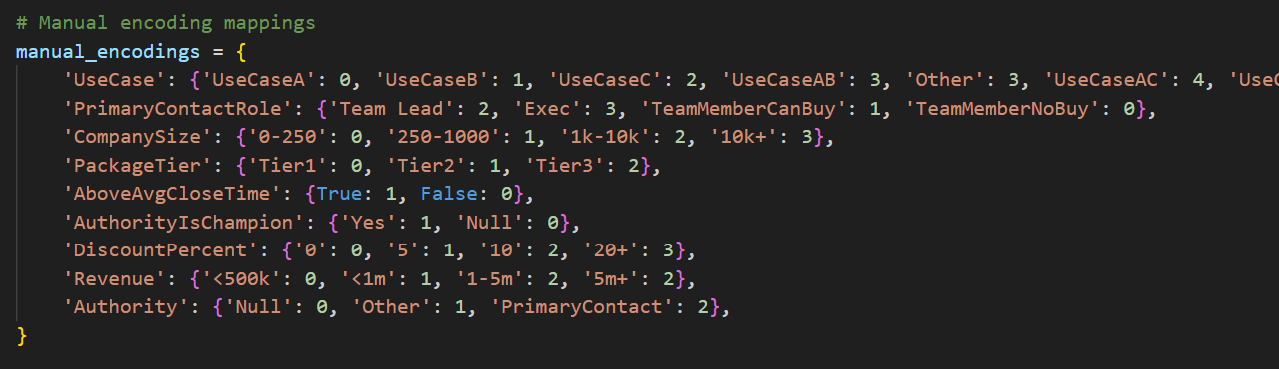
Each dot is an Opportunity. Dots to the Left on the chart are less likely to close. Red vs Blue indicates high/low values for the metric (ie: $33k ACV = red, $20k = blue). Categorical features like UseCase were manually encoded as shown below.
We can see we do well with smaller companies, and it's not good if deals take much longer than average to close. At first glance ACV seems a bit unrelated, but I know Use Cases are related to ACV and we seem to have mixed results with high-value Use Cases.
UseCases that correlate with higher ACVs are encoded to be higher in "Feature Value". So the red dots in UseCase are also higher ACV customers, suggesting the high-value accounts we're closing may be closely tied to the success seen with higher discounts.
Taken together this can signal some cause for concern... Higher tier, higher cost packages appear to do worse unless discounted. Sales are still growing though, so even if validated this suggests we have room to tweak packaging, pricing, our target customer, etc. to see even more growth.
If we feel optimistic about these challenges, we can be optimistic in our forecast.
To begin our forecasting, we can take our growth from last year and project it out linearly (what if we just keep doing this?)... Using our growth rate since April, we'd basically double revenue in FY25, closing ~38 deals at roughly $22k each.

I used the Average Since April instead of the 35% because April was a clear anomaly.
If we're expecting modest growth, 6.5% would only be an extra $100k, or about 4-5 extra deals closing across the whole year (assuming 100% retention).
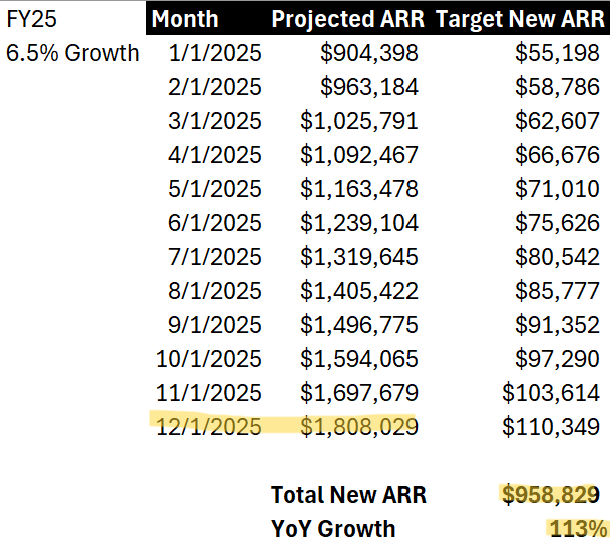
If we're in hypergrowth and have validated and feel comfortable about the challenges presented by our model, we can boost our targets more. Aiming for 8% monthly growth would have us close the new FY at $2.1m, a YoY increase of ~$440k ($150%), more than doubling from 38 to ~96 Closed Won deals.
More can be done to assess Lead flow (Do we expect to have enough pipeline to support these projections? When does our model expect existing Opps to close? How does this look by Territory?) and other related concerns - but for now we now have a better understanding of our sales potential and a base for a trusted forecast.